

UQOX: Universal Quality of Experience
Under the skin of the users: UQOX is a system that allows the operator to objectively measure the Quality of Service delivered to its customers and precisely how the user perceives that service. The system allows those in charge of the Network, NOC Engineers and Customer areas to understand how the end user relates to the service through the measurement of technical and market parameters.
Not all is explained in vendors’ platforms……
UQOX is a system that allows the operator to objectively measure the Quality of Service delivered to its customers and precisely how the user perceives that service.
The system allows those in charge of the Network, NOC Engineers and Customer areas to understand how the end user relates to the service through the measurement of technical and market parameters.
-
Think as an End-User
- Imitates the end user behavior and reveals the issues as they affect them
- Perform same standardized test in different points of the network
- Collect and cross other sources of census data to enhance analysis
- Allows to compare and tabulate critical information
- Current situation
- It is common for NOC operators and / or network engineers do not have the necessary tools to identify and qualify the Quality of Experience of a service, given that they are delivered by different technologies and in different networks
- Executives and Network Administrators have access to reports and statistics of failures, but rarely have information about the Quality of Experience “End-to-End” as it is perceived by the user
So, how does it work?
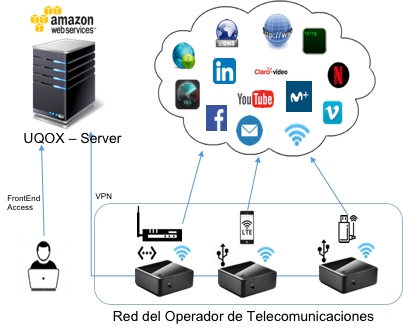
For a common deployment of Quality of Experience measurement, probes are placed in the network, simulating the connection of a user, following the distribution of the clients and the best-selling plans.
The System collects the results obtained in each of the probes, the system analyzes, tabulates and saves the information to be presented in individual graphs or in more complex reports
The cross-visualization of the different results can quickly show the origin of the problem and solve problems in the network before they cause problems in the perception of the service
All the administration is in the UQOX server, the management and configuration of tests and reports
The probes can be connected in various configurations, depending on the objective of each deployment
Source of Information
- It allows to evaluate, measure, format and present any quantitative element available in a device, in particular:
- Network Devices: Using SNMP or other proprietary protocols
- Other systems: Parse (process) of Files, Databases, Synchronization and Views
- UQOX application: Perform several measurements per protocol, application and / or destination. Among the most common are:
- Wi-Fi: Number of AP’s, channels, signal levels, etc.
- Transfer: Maximum, Minimum, average and other statistics
- Web, loading and active elements in a web page
- Data transfer, via http or ftp
- Ping, latency, time between 2 given points
- DNS, resolution time and event analysis
- TraceRoute and reverse TR, evaluate the route that the return traffic could take
- YouTube, download and view videos of specific resolution
- Streaming, video viewing (*)
- SpeedTest.net by OOKLA, using the Web application (*)
UQOX – Configurable Elements
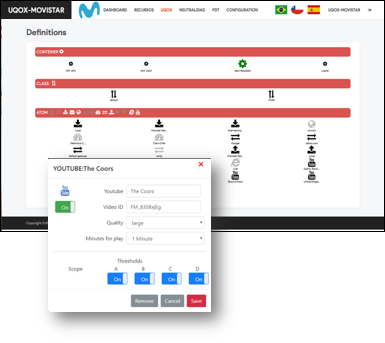
From a wide variety of sources …
- It allows grouping and configuring multiple probes with certain tests
- Youtube
- Adult Video
- SpeedTest
- Data transfer
- Wifi
- Others
- Easy configuration for specific tests
WWW: Facebook and subscription services
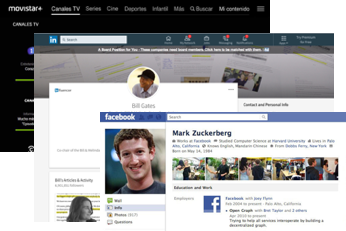
The information you need …
- The subscription test on HTML is able to enter a service account and navigate within it.
- Own Streaming Services
- The session is maintained and is not counted in the test and can perform the usual tasks of a user navigating the page
- All available TCP / IP information, plus navigation information
- DNS response time information
- Accounts shared between the probes
- Using the Zoftcom asset manager
- Example www.facebook.com
- 315 elements of a page
- No server delivered more than 3 elements
- Almost 200 different information points
WWW: Network Traffic Graphics
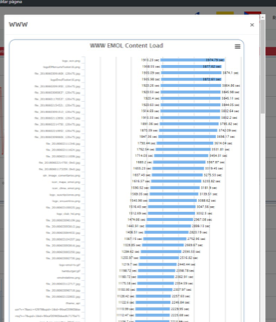
If you have doubts about how your clients live the web page of your company, how they relate day to day with the services provided for them, this is the tool you need to be able to address your efforts.
- Graphs per Network load and element
- Allows you to evaluate what elements make a page not load in the expected time
- Today the pages are elements of continuous load and not only to a certain place
- Possibility of Separating:
- Connection times
- Blocking
- SSL Time
- Wait time
- Reception time
- Handshake Times
- Send
- Enqueued
- DNS
![]() Questions? Please, use Contact Form or write as an e-mail!
Questions? Please, use Contact Form or write as an e-mail!